DataJourney
Graphs via Natural Language
“Load this dataset. Actually, try a bar chart. No, wait. A scatter might be better. Toss in a best-fit line and maybe change the color?”
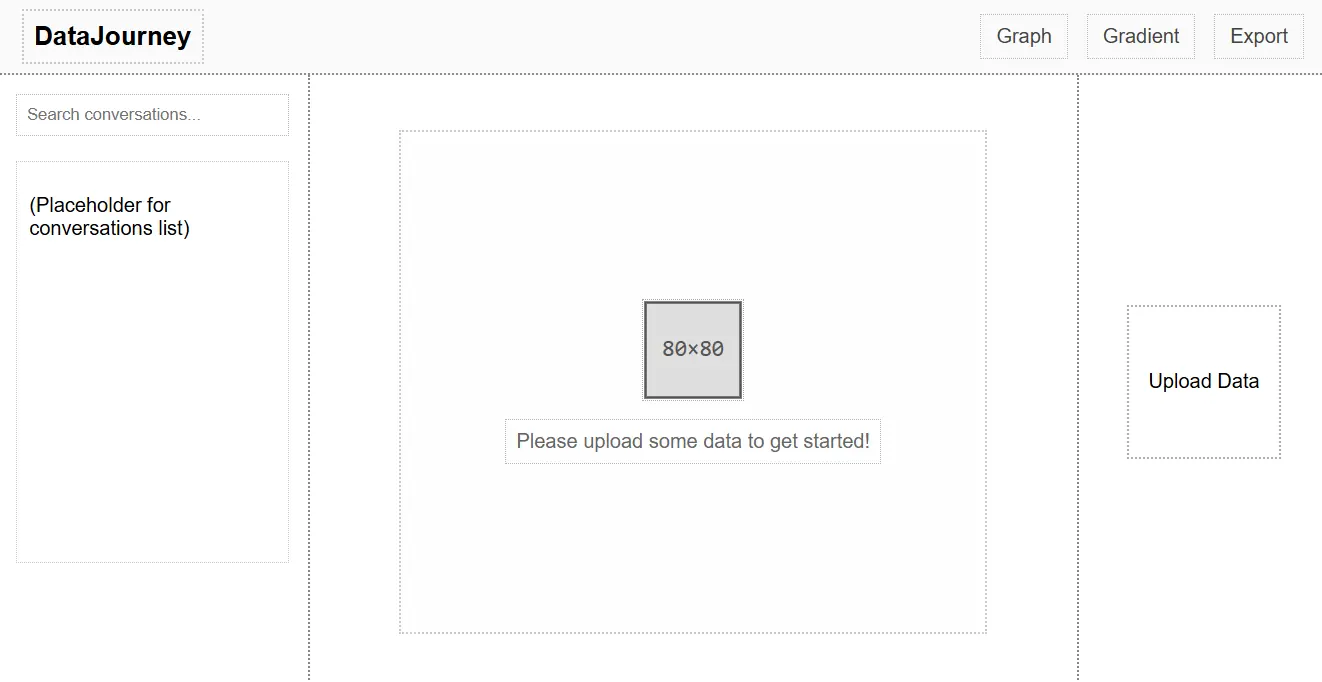
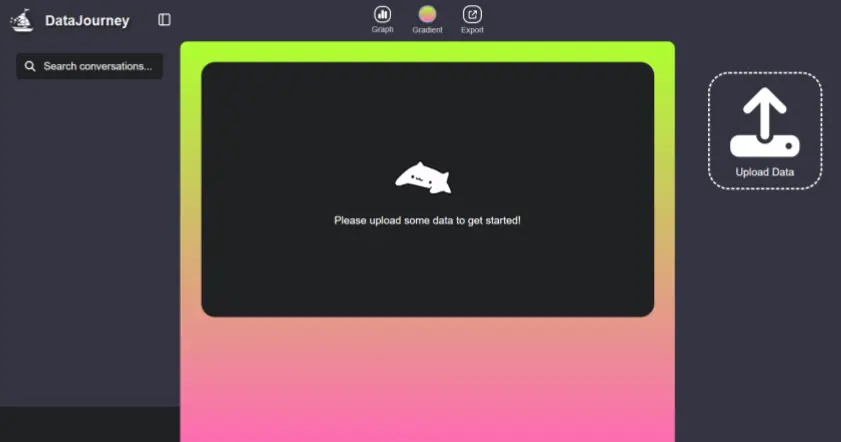
DataJourney does just that, bridging natural language queries and a data-visualization sandbox—like Midjourney but for your beloved CSVs or spreadsheets. We turn your hundred lines of matplotlib code into a one-sentence request, letting you go through graph variations until the meaning behind your data practically leaps off the screen—alongside a GUI that lets you quickly edit your graphs.
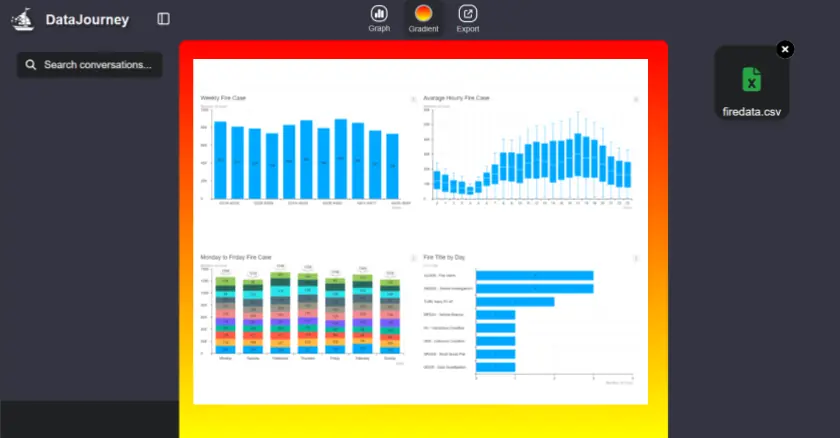
Under the hood, DataJourney juggles direct calls to natural language code generation, with specified libraries and inputs to create graphs for Plotly, Matplotlib, and other supported graphing software. Its real power lies in parsing your friendly instructions, guessing your intentions, and suggesting next steps. All your data manipulations can be tracked, similar to chats in a messaging app, with different variations of your graphs saved for later reference.
DataJourney is the perfect generator for your next graph. All you do is coax it with natural language and it’ll churn out polished visualizations or rapid prototypes. This was built atop the codebase of ComputeGPT, a tool we built for automatically running generated code safely and securely in your browser. We hope you enjoy the journey.