Heat Risk Dashboard
A Unified Geo-Referenced Overlay of NWS HeatRisk
and CDC Heat & Health Indicators
Part of Cornell's Initiative on Aging and Adaptation to Extreme Heat
Team: Gen Meredith, Yixuan Wang, Leihao Fang, Anthony Townsend, Ryan Hardesty Lewis
INTRODUCTION
Extreme heat is an increasingly urgent public health concern, influencing a wide range of health outcomes and straining emergency services, infrastructure, and communities. The Heat Risk Dashboard is an experimental prototype that integrates National Weather Service (NWS) HeatRisk forecasts with the Centers for Disease Control and Prevention (CDC) Heat and Health Index (HHI) indicators. By providing a unified, geospatially-referenced platform, users can quickly identify areas facing elevated heat risks and vulnerabilities across the United States.
This tool is designed to help decision-makers, emergency responders, public health agencies, researchers, and community members understand how heat intersects with socio-demographic factors, health systems, and infrastructure. By visualizing these complex data layers together, decision-makers can engage in data-driven planning, strategic resource allocation, and more proactive public outreach. Applications range from real-time situational awareness to historical trend analysis and scenario planning.
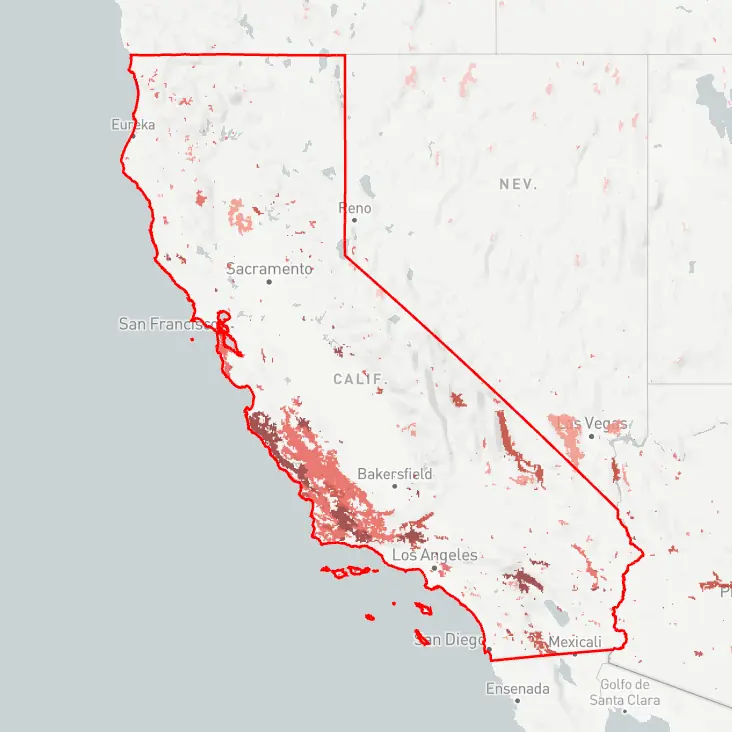
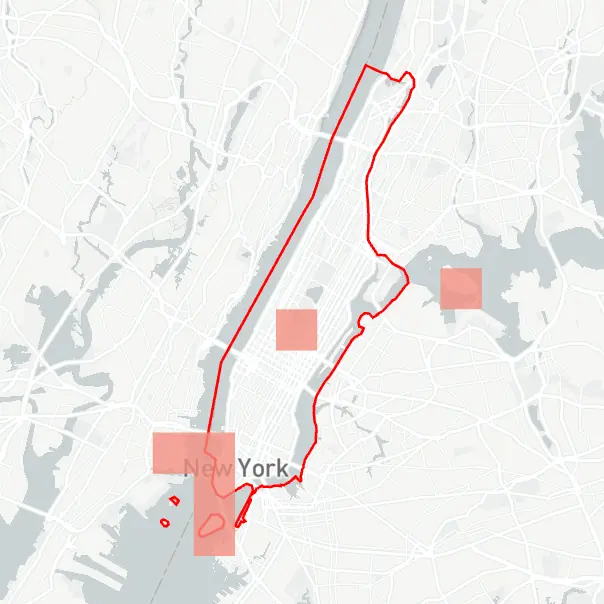
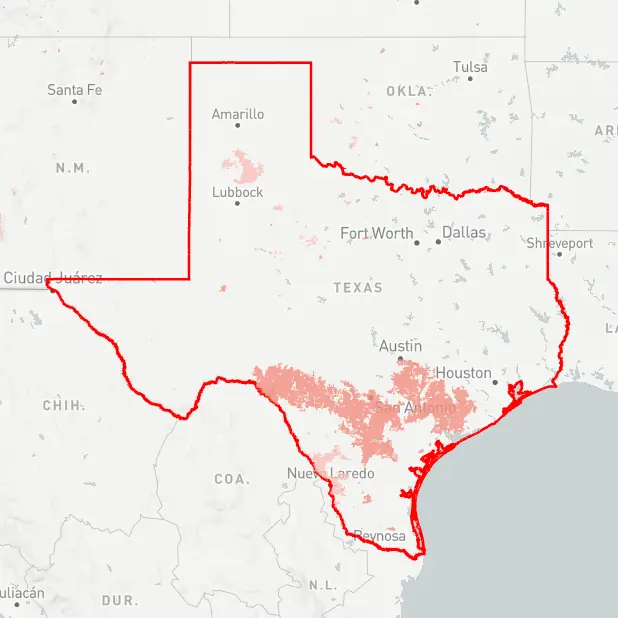
Geographic Exploration
Users can select specific states, counties, or ZIP codes to focus on local conditions. For example, here are a few static screenshots for California, New York, and Texas. Exploring different geographies helps stakeholders identify localized patterns of heat exposure, understand regional differences in vulnerability, and tailor interventions accordingly.
Data Sources & Indicators
The dashboard overlays 7-day NWS HeatRisk forecasts, providing a numeric and color-coded index that conveys the likelihood of heat-related impacts. Alongside HeatRisk data, it incorporates the CDC Heat and Health Index, covering various dimensions of vulnerability, from social factors (e.g., older adults, children, or individuals with disabilities) to broader health system constraints and environmental conditions. We foresee this being valuable for identifying new at-risk populations and targeting—for example, in parts of Arizona with an age indicator.
Beyond disability prevalence, the CDC's HHI includes factors like income levels, housing conditions, linguistic isolation, racial and ethnic composition, and more. Through percentile-based filters, users can pinpoint areas with the highest vulnerability levels, making targeted interventions possible. Geospatial data is preprocessed to ensure the forecast regions align properly with socio-demographic and health statistics at compatible scales, while data is updated nightly to ensure the most current information is available.
Visualization & Interactivity
The dashboard also provides a temporal component, allowing day-by-day forecast exploration or even reviewing historical data. Visual filters support customization of risk levels and indicators, enabling diverse analyses from real-time crisis management to long-term climate resilience planning. By integrating multiple data sources and flexible filters, the platform caters to varied stakeholder needs.
Technical Implementation & Future Developments
On the backend, automated scrapers retrieve and preprocess data from the NWS and CDC daily, creating unified geoparquet files that merge HeatRisk forecasts with area-weighted CDC HHI indicators. The frontend is a modern JavaScript web app containerized for AWS deployment, engineered for scalability and future data layer integrations (e.g., air quality, cooling centers, or energy usage patterns).
We are currently actively beta-testing the platform with public health officials and testers, courtesy of our partnership with Weill Cornell. Future developments include integrating additional data sources, as well as using information from the beta test to refine the user interface and what predictors are most useful for public health concerns.
Live Dashboard
Below is an embedded view of the live dashboard. Adjust the date, location, indicators, and thresholds to see the map update in real time. Data is refreshed daily by according to the latest NWS updates, while CDC indicators are updated monthly.
Acknowledgements
We would like to thank Weill Cornell Medicine for their support and collaboration on Cornell Aging and Adaptation to Extreme Heat Initiative.
Special thanks to the National Weather Service, Centers for Disease Control and Prevention, and the Urban Tech Hub at Cornell Tech.